5 Easy Steps to Using the Market Profile Report
Learn more on how to use The Market Profile: Lead Cohorts and Conversion report in Partner Central more effectively. 

Each family has a set of characteristics. When we look at all families that were referred to you, they all share one characteristic: We call that group a “cohort.” The Market Profile: Lead Cohorts and Conversion report in Partner Central groups the families that A Place for Mom has introduced to your community into common cohorts so you can gain insight into how families behave when looking for senior living and where you might have opportunities to understand and connect with them better.
We outlined five steps that you can take to use this new report like a pro. Access your reports menu in Partner Central and click on the name of the report to get started.
1. Run the Report
You can run this report over any time frame you’d like. Start at one year and add more time if you need more data. Print out a copy of the report and dust off that highlighter to identify your best opportunities for success.
2. Get to Know the Market Profile
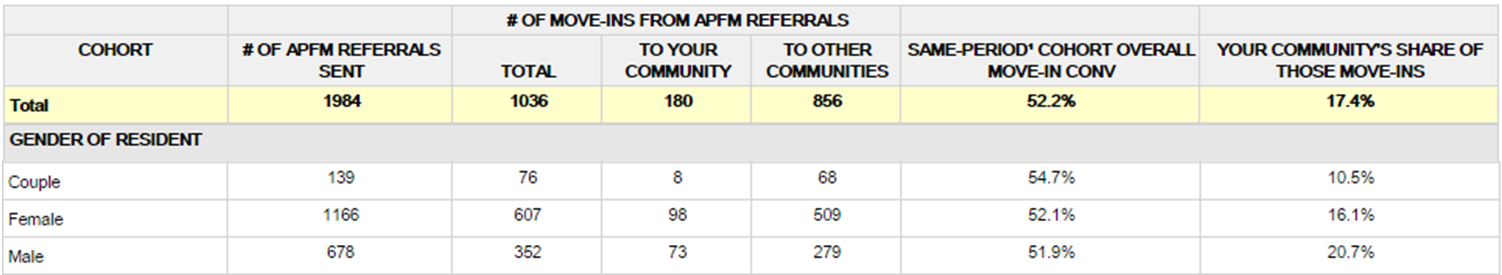
The yellow row at the top of the report shows your overall referrals received and moved in (your community or a competitor), as well as the average conversion rate of those leads and your average market share. You’ll see your list of cohorts along the left side of the report.
The first section is the gender of the resident. All leads we send to you fit into only one of these three cohorts. If you ignore everything else about a resident except their gender, we can take a look at how likely it is that men, women or couples will move in and how often they will choose your community.
3. Identify High-Converting Cohorts

Take note of the column “Same-Period Cohort Overall Move-In Conv.” This is APFM’s conversion rate for leads we sent to you during that time frame. Go down this column and highlight any cell where the percentage is higher than your average conversion rate.
4. Investigate your Market Share

The last column to the right shows “Your Community’s Share of Those Move-Ins” that resulted from APFM leads sent to your community. Take note of your average share. Go down this column and highlight any cell where the percentage is lower than your average share.
5. Find Your Opportunities

You should have a report that looks kind of like a checkerboard with your highlights. For each cohort where you have highlighted both the conversion rate and the market share, highlight the cohort in the first column. These are your opportunities!
Each cohort you highlighted in step three represents a type of family that has a high likelihood to move in, but that hasn’t typically chosen your community. In this example, couples are moving into communities, which you can see from the high conversion rate, but the market share is low, so they aren’t moving into this community. Is the community making sure that they introduce couple prospects to other couples currently residing in their community? Are there apartments available that would be appropriate for a couple?
Go over each cohort section carefully to understand how long families take to choose a community, how likely it is that they’ll move based on their initial budget estimation and more. The Market Profile will help you think about families in a different way and focus your marketing efforts on families that are motivated to find the right community for their loved one.
Do you have questions on how to use A Place for Mom’s Partner Central more efficiently? Please leave your questions in the comments below.¬†


